デジタル
デジタル
 ゲーム・ホビー
 システム・通信
 観光・レジャー
 エンタメ
エンタメ
 スポーツ・アウトドア
 自動車・バイク
 ホーム
ホーム
 ファッション
 食・グルメ
食・グルメ
 美容・健康
美容・健康
 ライフスタイル
 金融・保険
金融・保険
 広告・宣伝
広告・宣伝
 交通・物流
交通・物流
 エネルギー・環境
 自治体など
自治体など
ブラウザだけで使える無料統計ソフト Reactive stat の統計手法の検索機能をアップデートしました
エミュイン合同会社
2024.09.15 21:12
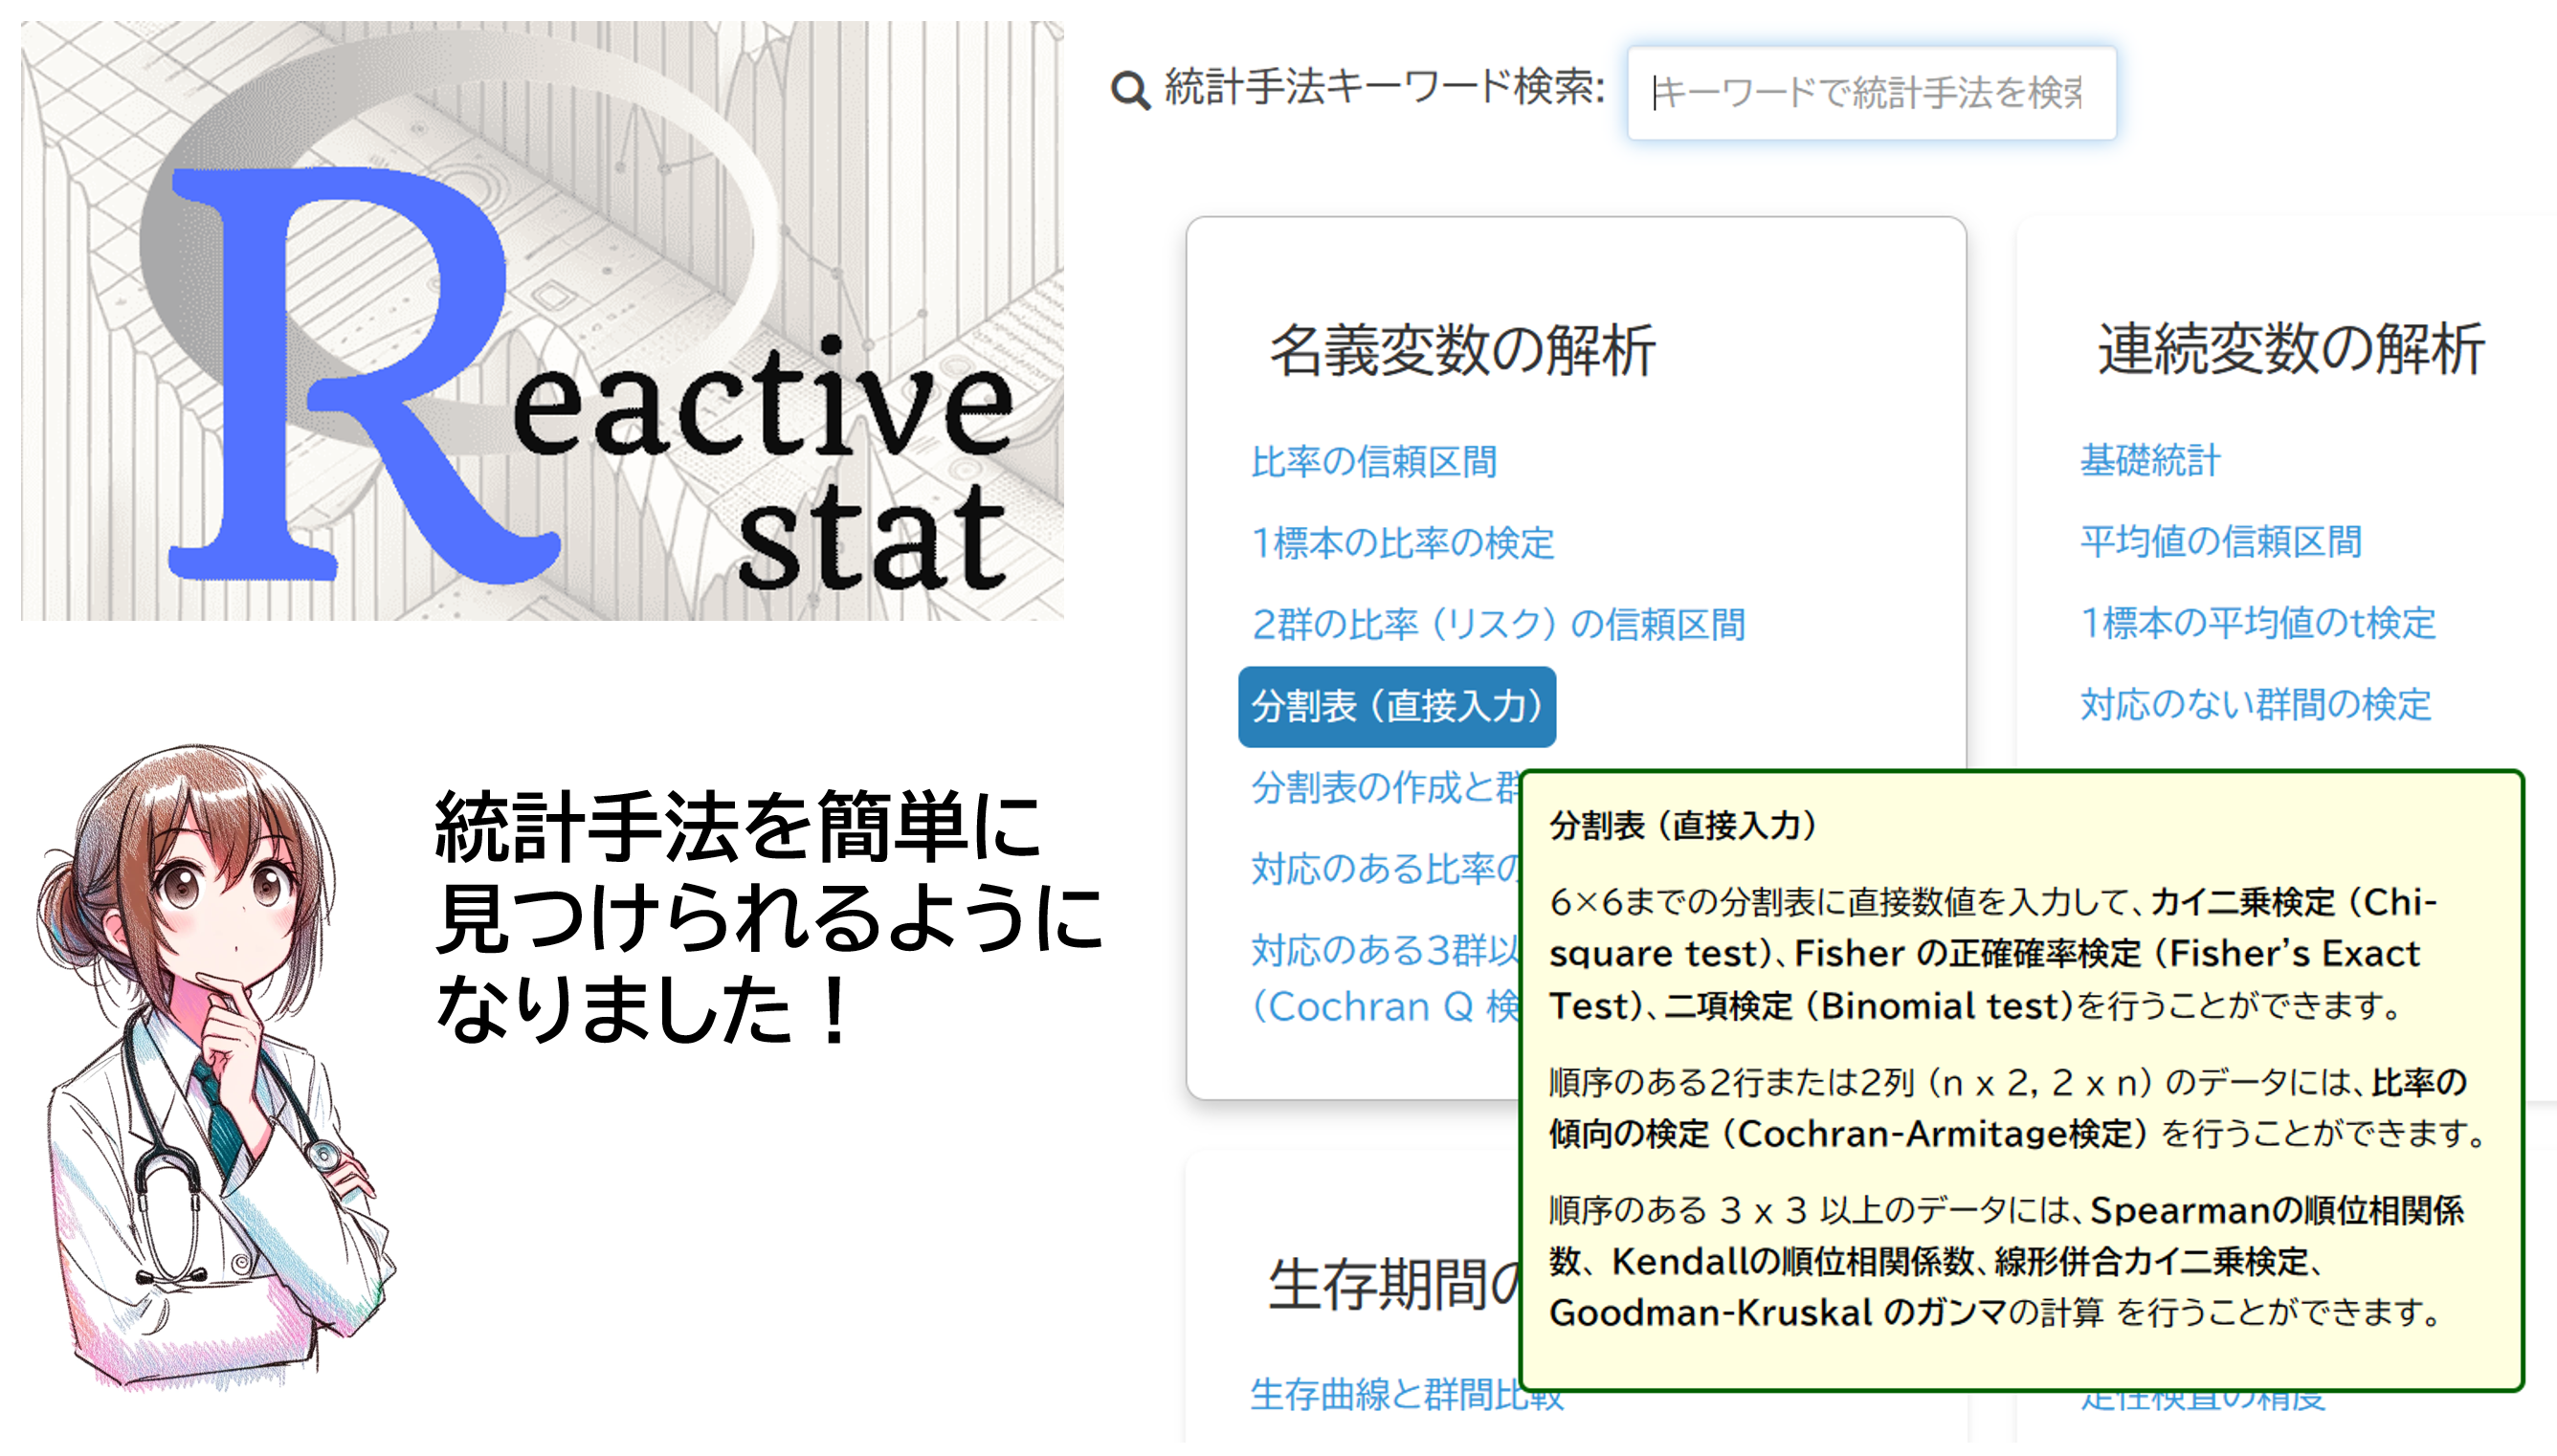
Reactive stat は、信頼性の高い R で統計解析し、その結果を AI が解説します!
様々な統計手法をサポートしており、それらを有機的に統合していますので、逆にその機能を見つけづらいというご意見もありました。そこで、強力な検索機能を付けましたので、どうぞご活用ください。
統計手法キーワード検索
Reactive stat は、ブラウザだけで使える無料統計ソフトであり、様々な統計手法をサポートしています。そのため、思った機能を探し出すのに時間がかかったり、その機能を見つけられずサポートされていないと思われることがあるようです。
そこで、キーワードで簡単に検索できる機能を実装しました。

利用法

検索ボックスに、キーワードを入れると、ヒット祖いた項目がハイライトします。
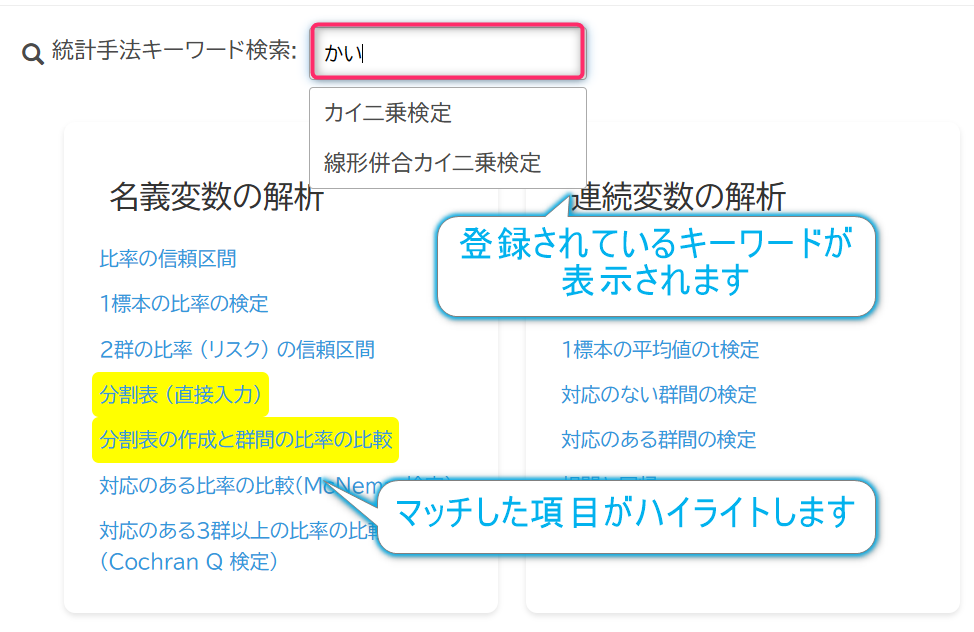
地味ですが、非常に便利ですのでご活用ください。
人名のついた統計手法は、日本語読みと原語表示と両方をキーワードに入れています。
統計手法一覧

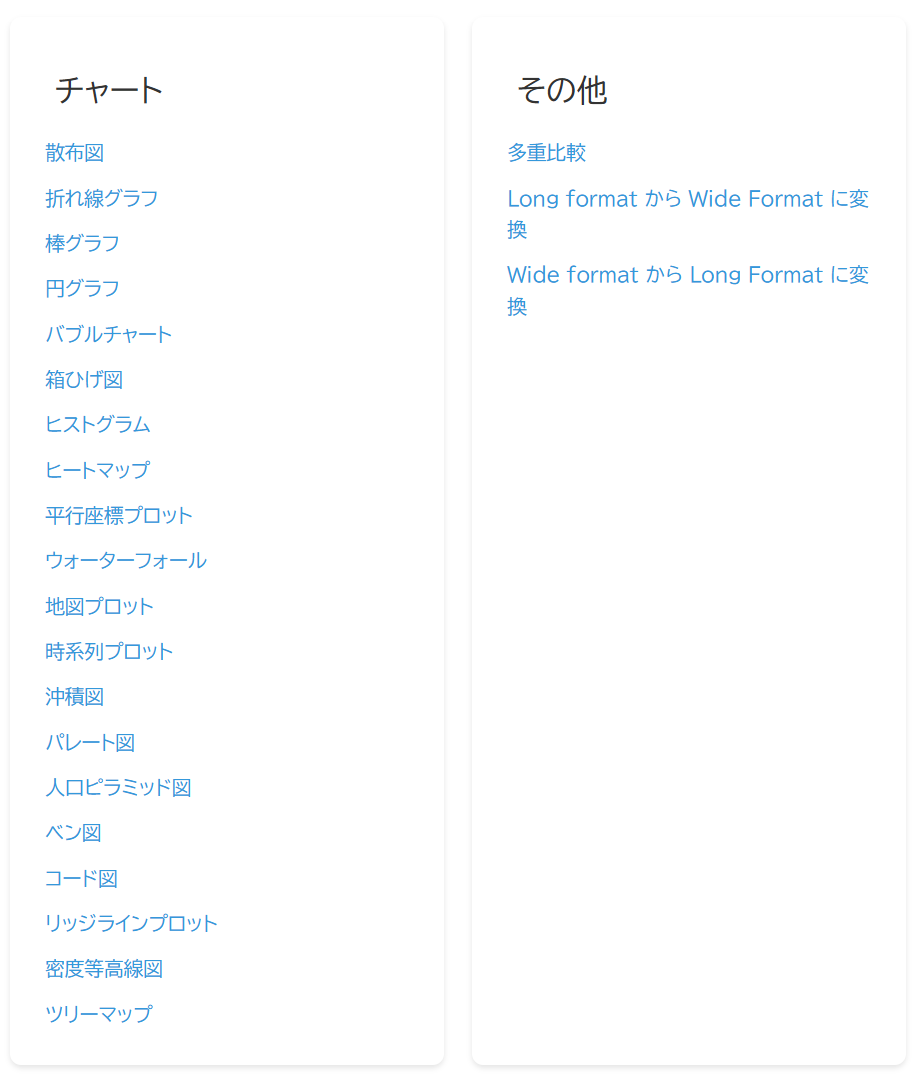
Reactive stat は、ブラウザだけで使える無料統計ソフトです。信頼性の高い R で統計解析し、その結果を AI が解説します!

キーワード一覧
2024/9/15 現在、登録されているキーワードは以下の通りです。
比率の信頼区間, confidence interval for a proportion, 母集団, population,
プロポーション, proportion, 母集団の比率, 母比率, parent population proportion,
真の比率, true proportion, 信頼区間, confidence interval, 1標本の比率の検定,
one sample proportion test, 母比率, population proportion, 2群の比率の差の信頼区間,
confidence interval for a difference between two proportions,
2群の比率の比の信頼区間, confidence interval for a ratio of two proportions,
2群の比率のオッズ比の信頼区間, confidence interval for a odds ratio of two proportions,
オッズ比, odds ratio, リスク比, risk ratio, リスク差, スコア法, Score test, Wald法,
Wald test, ワルド法, ヴァルド法, 分割表, two-way table, contingency table,
カイ二乗検定, chi-square test, Fisherの正確確率検定, Fisher's exact test,
フィッシャーの正確確率検定, 比率の傾向の検定, trend test for proportions,
Cochran-Armitage検定, コクラン-アーミテージ検定, Cochran-Armitage test, 二項検定,
binomial test, Spearmanの順位相関係数, Spearman's rank correlation coefficient,
Kendallの順位相関係数, Kendall's rank correlation coefficient, 線形併合カイ二乗検定,
線形-線形関連性検定, Linear-by-Linear Association Test, Goodman-Kruskal のガンマ,
Goodman-Kruskal gamma, 対数オッズ比, log odds ratio, 対数リスク比, log risk ratio,
対応のある比率の比較, comparison of paired proportions, McNemar検定, マクネマー検定,
McNemar test, Bowker検定, バウカー検定, Bowker test, McNemar-Bowkerの対称検定,
マクネマー・バウカーの対称検定, McNemar-Bowker test of symmetry, 二値変数,
binary variable, 対応のある3群以上の比率の比較,
comparison of paired proportions for more than 3 groups, Cochran Q 検定,
Cochran Q test, コクランのQ検定, Kendallの一致係数,
Kendall's coefficient of concordance, 効果サイズの指標, 基礎統計, basic statistics,
中央値, median, 平均値, mean, average value, 分散, 不偏分散, variance, 標準偏差,
standard deviation, 平均の標準誤差, standard error of mean, ヒストグラム, histogram,
箱ひげ図, box plot, バイオリンプロット, violin plot, ランクプロット, rank plot,
累積分布関数プロット, cumulative distribution function plot, 正規確率プロット,
normal probability plot, 統計計算, statistical calculation, Kolmogorov-Smirnov検定,
Kolmogorov-Smirnov test, コルモゴロフ-スミルノフ, Smirnov-Grubbs検定,
Smirnov-Grubbs test, スミルノフ-グラブス検定, Shapiro-Wilk検定, Shapiro-Wilk test,
シャピロ-ウィルク検定, minimum value, 最小値, first quartile, 第1四分位数,
third quartile, 第3四分位数, maximum value, 最大値, interquartile range, 四分位範囲,
outliers, 外れ値, sample variance, 標本分散, sample standard deviation, 標本標準偏差,
skewness, 歪度, kurtosis, 尖度, 平均値の信頼区間, confidence interval for a mean,
真の平均値, true mean, 1標本の平均値のt検定, one sample t-test, 対応のない群間の検定,
independent group tests, 分布, distribution, t検定, t-test, F検定, F-test, ANOVA,
分散分析, analysis of variance, 一元配置分散分析, One-Way ANOVA, Welchの方法,
Welch's method, Bartlett検定, Bartlett's test, バートレット検定, Levene検定,
Levene's test, ルビーン検定, ルヴィーン検定, Tukey HSD, テューキー HSD,
テューキーの範囲検定, Games-Howell法, Games-Howell test, Tamhane's T2検定,
Tamhane's T2-test, Mann-Whitney U検定, Mann-Whitney U test, マン・ホイットニーのU検定,
Brunner-Munzel検定, ブルンナー-ムンツェル検定, Kruskal-Wallis検定,
Kruskal-Wallis test, クラスカル-ウォリス検定, Jonckheere-Terpstra検定,
Jonckheere-Terpstra test, ヨンクヒール-タプストラ検定, 等価性試験, equality test,
同等性試験, equivalence test, 非劣性試験, non-inferiority test, 優越性試験,
superiority test, 対応のある群間の検定, paired group tests, 散布図, scatter plot,
並列座標プロット, parallel coordinate plot, 対応のある t検定, paired t-test,
Wilcoxon の符号順位検定, Wilcoxon signed-rank test, ウィルコクソンの符号順位検定,
反復測定ANOVA, repeated measures ANOVA, フリードマン検定, Friedman 検定, Friedman test,
Wilcoxonの符号順位検定を用いたペアワイズ比較,
pairwise comparison using Wilcoxon signed-rank test, 相関と回帰,
correlation and regression, 関係分析, relationship analysis, 相関係数,
correlation coefficient, 回帰直線, regression line, 確率楕円, probability ellipse,
Pearsonの積率相関係数, ピアソンの積率相関係数,
Pearson's product-moment correlation coefficient, 単回帰, simple regression,
univariate regression, 散布図行列, scatterplot matrix, 相関関係, 変数間の関係性,
relationship between variables, 潜在的関連性, potential relationship, 多変量分析,
multivariate analysis, 複数の説明変数, multiple explanatory variables, 従属変数,
dependent variable, 説明変数, independent variable, explanatory variable,
変数の選択, variable selection, ロジスティック回帰モデル, logistic regression model,
ANCOVA, 分散共分散分析, analysis of covariance, 重回帰分析,
multiple regression analysis, 多変量分散分析, Multivariate Analysis of Variance,
MANOVA, 主成分分析, principal component analysis, PCA, 因子分析, factor analysis,
線形混合効果モデル, linear mixed effects model, LMM, 固定効果, fixed effect,
ランダム効果, random effect, 階層構造, hierarchical structure, クラスター構造,
cluster structure, 時間依存性, time dependency, データ解析, data analysis, 最尤法,
maximum likelihood method, 制限最尤法, restricted maximum likelihood method, 推定,
estimation, マルチレベルモデル, multilevel model, 階層線形モデル,
hierarchical linear model, 生存曲線, survival curve, Kaplan-Meier法,
カプラン-マイヤー法, Kaplan-Meier method, イベント, event, 生存率, survival rate,
Logrank検定, ログランク検定, logrank test, Logrank trend検定, ログランク傾向検定,
logrank trend test, 生存期間, survival time, Cox比例ハザード回帰,
コックス比例ハザード回帰, Cox proportional hazards regression, Cox比例ハザードモデル,
コックス比例ハザードモデル, Cox proportional hazards model, 生存時間, 予測変数,
predictor variable, リスクの評価, risk assessment, 観察期間, observation period,
比例ハザード性分析, proportional hazards analysis, 定性検査, qualitative test, 精度,
accuracy, 診断テスト, diagnostic test, 感度, sensitivity, 特異度, specificity,
陽性的中率, positive predictive value, PPV, 陰性的中率, negative predictive value,
NPV, 評価者の一致度, agreement between evaluators, Kappa係数, カッパ係数,
kappa coefficient, κ, Z統計量, z-statistic, カテゴリカルデータ, categorical data,
陽性・陰性 的中率, positive/negative predictive value, 診断手法, diagnostic method,
真の陽性, true positive, 真の陰性, true negative, ROC曲線, ROC curve, 性能評価,
performance evaluation, 診断目的, diagnostic purpose, 質問項目の信頼性の評価,
evaluation of questionnaire reliability, Cronbachのα信頼性係数,
コクランのα信頼性係数, McDonaldのω係数, マクドナルドのω係数,
Cronbach's alpha coefficient, 一貫性, consistency, 内的一貫性, internal consistency,
相関ヒートマップ, correlation heatmap, 傾向スコアマッチング,
propensity score matching, PSM, 観察データ, observational data, 因果関係,
causal relationship, バイアス, bias, 傾向スコア, propensity score, 共変量,
covariate, Mantel-Haenzel検定, マンテル・ヘンツェル検定, Mantel-Haenszel test,
層別解析, stratified analysis, 条件付ロジスティック回帰,
conditional logistic regression, ランダム化比較試験, randomized controlled trial,
RCT, 疫学研究, epidemiological study, 選択バイアス, selection bias, 比例ハザードモデル,
proportional hazards model, 生存分析, survival analysis, リスク, risk, ハザード率,
hazard ratio, 閾値奏効率, threshold response rate, 期待奏効率,
expected response rate, サンプルサイズ, sample size, 単一群, single arm, 第Ⅱ相試験,
phase II trial, 1群の比率, proportion of one group, 奏効率, response rate, 発生率,
incidence rate, 既知の比率, known proportion, 効果, effect, 介入, intervention,
検出力, statistical power, 差異, difference, 2群の比率, proportion of two groups,
統計的検定, statistical test, 対応のある2群, paired two groups, 比較, comparison,
治療, treatment, 変化, change, 被験者数, number of subjects, 散布図, scatter plot,
関係性, relationship, 観測値, observation, 傾向, trend, 折れ線グラフ, line graph,
時間経過, time progression, 周期性, periodicity, エラーバー, error bar, 棒グラフ,
bar chart, 度数, frequency, 合計値, total, 円グラフ, pie chart, 角度, angle, 円周,
circumference, パーセンテージ, percentage, バブルチャート, bubble chart, 3次元データ,
3D data, 量的変数, quantitative variable, 要約統計量, summary statistics, 四分位数,
quartile, 散らばり具合, spread, ヒートマップ, heat map, カテゴリ, category, セル,
cell, クラスタリング, clustering, 特異点, anomaly, 平行座標プロット,
parallel coordinates plot, データポイント, data point, トレンド, trend,
ウォーターフォール, waterfall plot, がん臨床試験, cancer clinical trial, 腫瘍縮小,
tumor shrinkage, 疾患進行, disease progression, 地図プロット, map plot, 緯度,
latitude, 経度, longitude, マーカー, marker, 住所, address, 郵便番号, postal code,
時系列プロット, time series plot, 日付, date, 期間, period, 沖積図, alluvial diagram,
パレート図, Pareto chart, 人口ピラミッド図, population pyramid, 年齢構成, age structure,
性別, gender, 人口動態, demographics, ベン図, Venn diagram, 集合, set, 共通部分,
intersection, コード図, chord diagram, ネットワーク, network, リッジラインプロット,
ridgeline plot, 確率分布, probability distribution, 密度プロット, density plot,
密度等高線図, contour plot, 等高線, contour line, 2次元分布, 2D distribution,
ツリーマップ, treemap, 面積表現, area representation, Bonferroni法,
Bonferroni correction, ボンフェローニ法, Holm法, Holm-Bonferroni method, ホルム法,
Hochberg法, Hochberg procedure, ホッホベルグ法, Hommel法, Hommel procedure, ホンメル法,
Benjamini-Hochberg法 (BH), Benjamini-Hochberg procedure, ベンジャミニ・ホッホベルグ法,
Benjamini-Yekutieli法 (BY), Benjamini-Yekutieli procedure, ベンジャミニ・イェクティエリ法,
Long format, ロングフォーマット, 縦長形式, Wide Format, ワイドフォーマット,
横広形式, 幅広形式
企業担当者の連絡先を閲覧するには
会員登録を行い、ログインしてください。